
Street by Street: How Neighborhood Heat Mapping Proves the Cooling Power of Urban Trees
Why Regional Heat Averages Conceal Everyday Urban Realities
A regional weather forecast can report a single summer temperature for an entire city, yet the experience of heat may differ sharply from one block to the next. A shaded residential street, a treed schoolyard, and a corridor lined with asphalt, brick, and unshaded concrete can occupy the same postal code while exposing residents to very different thermal conditions. Regional averages smooth out these differences, making the hottest places appear less severe and the most protected places appear more representative than they really are.
Built surfaces absorb solar energy during the day and release it slowly after sunset. Dense buildings can restrict airflow, while dark roads and parking areas create broad heat sinks. These conditions affect people walking to transit, children playing outdoors, older adults, outdoor workers, and households that cannot reliably afford air-conditioning. Research on urban environmental conditions increasingly points toward the value of fine-grained observation, because meaningful adaptation begins with knowing which streets carry the greatest burden. Participatory science adds that ground-level detail by allowing residents to document heat where it is actually lived.
Community Science on the Move with Mobile Thermal Mapping
Mobile thermal mapping turns a city into a living field laboratory. In campaigns supported by NOAA, volunteers have used sensors mounted on cars to travel predetermined routes three times in one day, typically during the morning, afternoon, and evening. The instruments record temperature, humidity, and location at frequent intervals, creating a moving record of how heat changes across streets and through the daily cycle. Similar equipment can be adapted for bicycles or other neighborhood-scale surveys when routes and safety conditions allow.
This approach complements, rather than replaces, satellite imagery and fixed weather stations. Satellites are valuable for identifying broad land-surface patterns, but they do not directly describe the air temperature experienced by a person standing beneath a tree or waiting beside a sunlit wall. A mobile sensor can capture those transitions street by street, including the cooling influence of canopy, the warmth retained by pavement, and the differences between open lots and compact building fronts. In one NOAA-supported campaign, datasets were expected to contain more than 80,000 measurements per city, providing a level of detail that regional monitoring cannot supply.
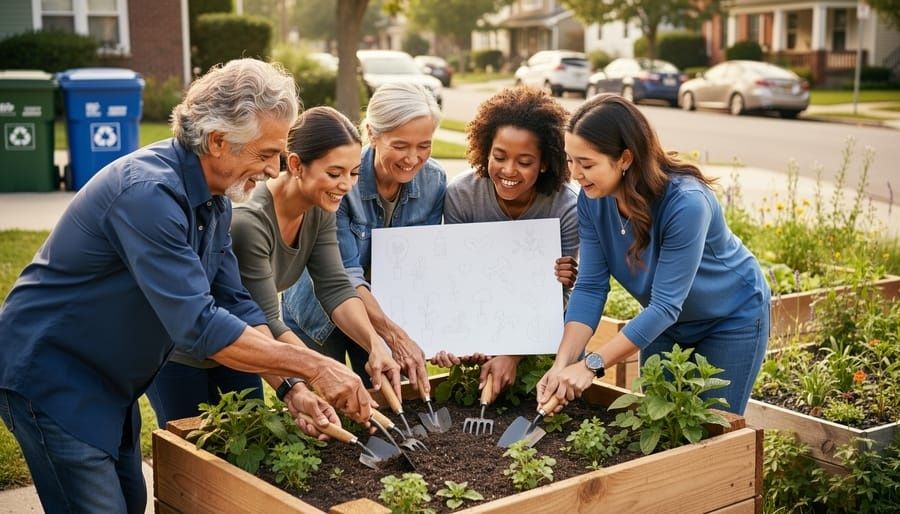
A well-organized campaign should make the method visible and repeatable. Residents are not merely asked to collect data; they can help define routes, identify locations of concern, interpret maps, and connect findings to local priorities. A practical sequence includes:
- Define the question. Identify whether the campaign is examining heat near schools, transit stops, senior housing, public housing, industrial corridors, or areas with limited tree cover.
- Standardize the route and timing. Use comparable routes and repeat measurements in morning, afternoon, and evening conditions so that results reveal daily persistence rather than a single moment.
- Train and document. Record sensor placement, travel speed, weather conditions, calibration checks, and any interruptions that could affect interpretation.
- Return the results to the neighborhood. Present maps in accessible formats, invite residents to test the findings against lived experience, and identify practical interventions together.
This process builds local agency because residents can see how evidence is produced and challenge conclusions that do not match conditions on the ground. In Allentown, Pennsylvania, civic science researchers found that heat concerns became a powerful point of engagement when connected to cooling access and everyday health. Their recommendations included deploying 10 to 15 low-cost sensors, expanding multilingual outreach, and establishing a more equitable tree-canopy program.
The 20-Degree Divide Between Tree Canopy and Bare Pavement
Urban heat mapping campaigns have repeatedly shown that developed areas with unshaded roads and buildings can be 15 to 20 degrees Fahrenheit warmer than nearby vegetated areas under appropriate conditions. The exact difference depends on time of day, weather, surface materials, wind, moisture, and the measurement method. Surface temperature and air temperature are not interchangeable: pavement can become far hotter than the air above it, while a shaded canopy may reduce radiant heat experienced by people even when the air-temperature change is more modest.
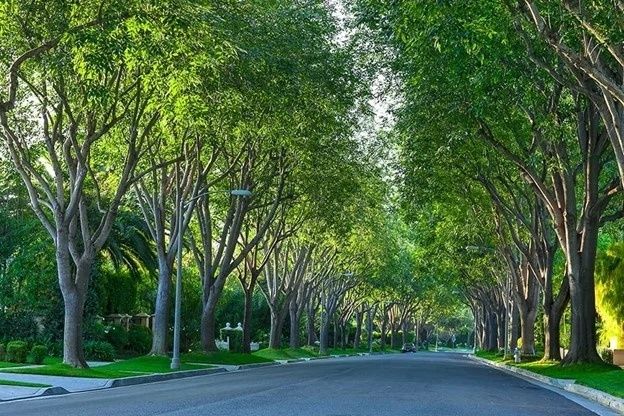
Trees cool streets through two linked mechanisms. First, leaves and branches intercept sunlight before it reaches asphalt, walls, sidewalks, and parked vehicles. That shade reduces the amount of energy stored in built materials and lowers mean radiant temperature, an important component of human thermal comfort. Second, trees release water through evapotranspiration. As moisture moves from soil through roots and leaves and then into the atmosphere, the process draws heat from the surrounding environment. The US EPA guidance on trees and heat islands explains why shading and evapotranspiration are central tools for reducing urban heat.
Street form determines how those benefits are distributed. A mature canopy over a narrow road may shade pavement and building walls for several hours, while trees planted in a broad parking lot may cool only the areas beneath and immediately around their crowns. A corridor with tall buildings can experience limited wind and prolonged heat storage, whereas a more open street may exchange heat more quickly. Comparing different settings helps planners avoid treating canopy as a simple count and instead evaluate where shade reaches people, how long it lasts, and whether it protects routes used by vulnerable residents.
| Observed feature | Likely thermal effect | Planning relevance |
|---|---|---|
| Dense, continuous canopy | More shade and broader cooling across surfaces | Prioritize long-term maintenance and replacement planning |
| Bare asphalt or concrete | High daytime surface heating and stored evening heat | Combine trees with reflective or permeable surface treatments |
| Mixed trees, shrubs, and grass | Layered shade and improved local moisture conditions | Use green infrastructure where space permits |
| Compact building corridor | Reduced airflow and increased radiant exposure | Place trees where crown spread can protect sidewalks and façades |
Quantifying How Leaf Density and Species Architecture Shape Microclimates
Tree quantity alone cannot explain cooling performance. A newly planted sapling may represent an important investment, but its immediate shade is limited. A mature tree with a broad crown, dense foliage, and healthy roots can alter the thermal conditions of an entire section of sidewalk. Crown spread, leaf area, trunk height, seasonal persistence, and transpiration all influence whether a tree provides meaningful protection during the hours when heat exposure is greatest.
A study of five small street-tree species in Manchester, United Kingdom, illustrates why species selection deserves careful attention. Researchers examined 51 trees across six residential locations and measured canopy dimensions, leaf area index, air temperature, mean radiant temperature, and surface temperature. Shade reduced mean radiant temperature by an average of 4 degrees Celsius, while surface temperatures fell by an average of 12 degrees Celsius. Species with higher leaf area index, including Crataegus laevigata and Pyrus calleryana, produced greater surface cooling than less dense canopies.
A systematic review of 115 studies published between 2018 and 2024 also cautions against applying a single universal tree formula. The review found that dense, tall canopies often generate broad-scale cooling, while combinations of trees with shrubs or grass can strengthen local effects. It also identified major gaps in research, particularly in arid and tropical climates and during extreme heat. Emerging ecological assessments in Nature”s Earth and Environment portfolio reinforce the need to examine how vegetative structure interacts with local urban form rather than assuming every planting produces the same result.
For planners and civic scientists, useful measurements include:
- Leaf area index and canopy density, which help estimate how much sunlight a tree can intercept.
- Crown spread and shade footprint, which show whether cooling reaches sidewalks, homes, transit stops, and play areas.
- Tree health and soil conditions, because compacted or dry soil can limit growth and transpiration.
- Seasonal behavior, including leaf retention, drought response, and performance during heat waves.
- Street geometry, which determines how shade, wind, and radiant heat interact.
Species selection must also account for root space, pests, water availability, overhead utilities, maintenance capacity, and future climate conditions. The strongest planting plan is therefore not simply the one with the fastest-growing trees. It is the plan that sustains healthy, structurally useful canopy over decades.
Turning Hyper-Local Thermal Records into Environmental Justice Action
Tree canopy is rarely distributed evenly. Lower-income corridors and neighborhoods shaped by historic redlining often contain fewer mature trees, more impervious surfaces, and greater exposure to traffic and industrial activity. These patterns are not accidental. Past decisions about lending, zoning, road construction, housing investment, and public works helped determine where shade and green space accumulated and where heat was allowed to intensify.
Hyper-local thermal records can make those inequities legible in a way that regional maps cannot. Chelsea, Massachusetts, offers a useful case. Its two-year Urban Heat Mitigation Project combined temperature monitoring, heat-index mapping, social vulnerability analysis, community engagement, and physical improvements. The city worked with GreenRoots, Boston University”s School of Public Health, and C-HEAT to identify heat islands and prioritize the Cool Block around Willow Street and Maverick Street, near destinations used by vulnerable residents.
The resulting interventions included five trees, native shrubs and grasses, bioswale planting, and light-colored sidewalks and roadways. The project used bilingual engagement, translated materials, interpretation, refreshments, and accessible neighborhood venues. That design matters because data collection without inclusive participation can reproduce the same gaps it is intended to reveal. In Allentown, researchers similarly identified the need for Spanish-speaking representatives and translated city materials, while noting that some outreach had missed vulnerable areas on the east side and in the river wards.
Once mapped, heat data can support specific demands rather than general appeals. Neighborhood organizations can use it to request:
- Targeted tree planting and funded maintenance in the hottest blocks.
- Pocket parks and shaded gathering areas near schools, transit, clinics, and senior housing.
- Permeable rights-of-way, bioswales, and soil improvements that support both cooling and stormwater management.
- Reflective or lighter-colored treatments for roads, sidewalks, and public facilities where trees cannot provide immediate coverage.
- Capital plans that measure canopy survival, shade access, and temperature reduction over time.
This is where civic science becomes part of governance. Municipal sustainability programs increasingly connect environmental monitoring to capital planning, public health, land use, and infrastructure investment. The most durable approach treats residents, technical experts, and public agencies as co-managers of a local data system. Thermal maps do not automatically produce justice, but they give communities a defensible basis for asking where resources go, whose health is at risk, and whether an intervention actually works.
Transforming Street-Level Data into Resilient Urban Sanctuaries
Block-level measurement changes the political meaning of urban heat. What once appeared as an abstract regional average becomes a documented condition at a particular bus stop, housing complex, school route, or pavement-heavy intersection. Mobile sensors, fixed monitors, canopy inventories, and resident testimony can be combined to show not only where heat is concentrated, but also which people face repeated exposure and which interventions offer the greatest protection.
Neighborhood groups can begin with a modest campaign: identify trusted local partners, select routes that reflect daily travel, borrow or purchase appropriately calibrated sensors, train volunteers, and publish methods alongside results. Measurements should be repeated across times of day and, where possible, across seasons. The findings should then be brought into budget hearings, tree-planting plans, transportation projects, public health discussions, and neighborhood design processes. A tree canopy is not decorative infrastructure. It is a living public asset that requires suitable soil, water, care, and long-term replacement planning.
When residents can point to a persistently overheated corridor and pair that evidence with a practical design, stewardship becomes measurable. A shaded street, a healthy root zone, a bioswale, and a safe public gathering space can form one connected system of resilience. The work begins with a sensor on a moving vehicle or bicycle, but its lasting purpose is larger: to ensure that every neighborhood has a fair chance to grow, cool, and remain livable through the hotter seasons ahead.